Note from original reference by
https://datascienceschool.net/view-notebook/cba6d8e7667646de9c27e8f9d75f040c/
* Suppose 3 random variables A,B,C
* Each random variable can have values within $$$[0,2]$$$
* Joint probability distribution of A,B,C
A B C P(A,B,C)
0 0 0 P(A=0,B=0,C=0)
0 0 1 P(A=0,B=0,C=1)
0 0 2 P(A=0,B=0,C=2)
...
2 2 1 P(A=2,B=2,C=1)
2 2 2 P(A=2,B=2,C=2)
* Number of parameters of joint probability distribution of A,B,C is $$$3^3-1=26$$$
which means you need 26 storages to store these parameters
================================================================================
In the real world,
the case where "only several specific random variables" affect "each other" is more often
than the case where "all random variables" affect "each other"
* Graphical probability model:
you express relationships of "only several random variables"
from "all random variables" by using graph structure
================================================================================
* Bayesian network model $$$\subset$$$ Graphical probability model
* Bayesian network model
1. Relationship of cause-result is clear
2. So, you can use "arrow" to express relationship
================================================================================
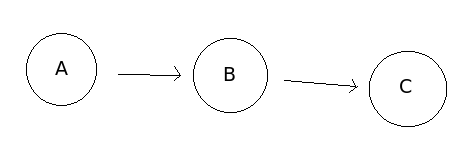
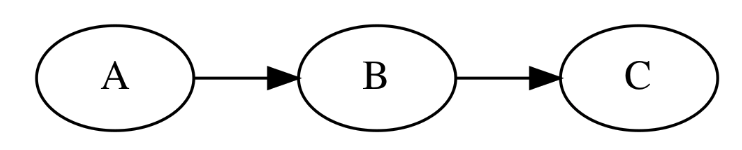 This is also called "directed graph" or "Bayesian network model"
Circle (node, vertex): random variable
Arrow (edge, link): relationship
================================================================================
"directed acyclic graph"
This is also called "directed graph" or "Bayesian network model"
Circle (node, vertex): random variable
Arrow (edge, link): relationship
================================================================================
"directed acyclic graph"
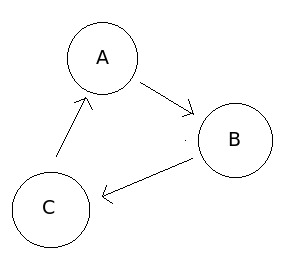
 "directed cyclic graph"
 ================================================================================
 * Cause -> Result
* Conditional probability: $$$P(B|A)$$$
================================================================================
* Joint probability by using multiplication of conditional probability
$$$P(A,B,C) = P(A)\times P(B|A)\times P(C|B)$$$
================================================================================
* Caution
* There can be "no direct causal relationship" between A (like health status) and B (like test score)
* There can be a student who has good health but who has low test score
* But there ca be "correlation relationship" between A (like health status) and B (like test score)
* Generally, when health is good, test score is good
================================================================================
* Factors which consist of joint probability of $$$P(A,B,C) = P(A)\times P(B|A)\times P(C|B)$$$
* Factor on A
Event A Probability of event A occuring P(A)
A=0 P(A=0)
A=1 P(A=1)
A=2 P(A=2)
* Factor on B
Event B P(B|A=0) P(B|A=1) P(B|A=2)
B=0 P(B=0|A=0) P(B=0|A=1) P(B=0|A=2)
B=1 P(B=1|A=0) P(B=1|A=1) P(B=1|A=2)
B=2 P(B=2|A=0) P(B=2|A=1) P(B=2|A=2)
* Factor on C
Event C P(C|B=0) P(C|B=1) P(C|B=2)
C=0 P(C=0|B=0) P(C=0|B=1) P(C=0|B=2)
C=1 P(C=1|B=0) P(C=1|B=1) P(C=1|B=2)
C=2 P(C=2|B=0) P(C=2|B=1) P(C=2|B=2)
* To model above joint probabilistic model,
you should know 14 number of parameters
* For $$$P(A)$$$: $$$3-1=2$$$
* For $$$P(B|A)$$$: $$$(3-1)\times 2=6$$$
* For $$$P(C|B)$$$: $$$(3-1)\times 2=6$$$
* Originally, you needed 26 number of parameters
* But by adding "information of relationship between random variables",
number of parameters you should know to model probabilistic model had reduced.
================================================================================
Joint probability distribution of Bayesian network
* How to create "Bayesian network"
1. Create nodes for random variables which you want to inspect
2. Create nodes which have a casual relationship to "above nodes"
3. Draw "arrows"
================================================================================
* Once you create the Bayesian network,
joint probability distribution of these random variables can be written as:
$$$P(X_1,\cdots,X_N) \\
= P(X_1|Pa(X_1)) \times P(X_2|Pa(X_2)) \times \cdots \times P(X_N|Pa(X_N)) \\
= \prod\limits_{i=1}^N P(X_i|Pa(X_i))$$$
$$$Pa(X_i)$$$: parent node of $$$X_i$$$ node, cause
$$$X_i$$$: child node, result
================================================================================
* Example of Bayesian network
* Cause -> Result
* Conditional probability: $$$P(B|A)$$$
================================================================================
* Joint probability by using multiplication of conditional probability
$$$P(A,B,C) = P(A)\times P(B|A)\times P(C|B)$$$
================================================================================
* Caution
* There can be "no direct causal relationship" between A (like health status) and B (like test score)
* There can be a student who has good health but who has low test score
* But there ca be "correlation relationship" between A (like health status) and B (like test score)
* Generally, when health is good, test score is good
================================================================================
* Factors which consist of joint probability of $$$P(A,B,C) = P(A)\times P(B|A)\times P(C|B)$$$
* Factor on A
Event A Probability of event A occuring P(A)
A=0 P(A=0)
A=1 P(A=1)
A=2 P(A=2)
* Factor on B
Event B P(B|A=0) P(B|A=1) P(B|A=2)
B=0 P(B=0|A=0) P(B=0|A=1) P(B=0|A=2)
B=1 P(B=1|A=0) P(B=1|A=1) P(B=1|A=2)
B=2 P(B=2|A=0) P(B=2|A=1) P(B=2|A=2)
* Factor on C
Event C P(C|B=0) P(C|B=1) P(C|B=2)
C=0 P(C=0|B=0) P(C=0|B=1) P(C=0|B=2)
C=1 P(C=1|B=0) P(C=1|B=1) P(C=1|B=2)
C=2 P(C=2|B=0) P(C=2|B=1) P(C=2|B=2)
* To model above joint probabilistic model,
you should know 14 number of parameters
* For $$$P(A)$$$: $$$3-1=2$$$
* For $$$P(B|A)$$$: $$$(3-1)\times 2=6$$$
* For $$$P(C|B)$$$: $$$(3-1)\times 2=6$$$
* Originally, you needed 26 number of parameters
* But by adding "information of relationship between random variables",
number of parameters you should know to model probabilistic model had reduced.
================================================================================
Joint probability distribution of Bayesian network
* How to create "Bayesian network"
1. Create nodes for random variables which you want to inspect
2. Create nodes which have a casual relationship to "above nodes"
3. Draw "arrows"
================================================================================
* Once you create the Bayesian network,
joint probability distribution of these random variables can be written as:
$$$P(X_1,\cdots,X_N) \\
= P(X_1|Pa(X_1)) \times P(X_2|Pa(X_2)) \times \cdots \times P(X_N|Pa(X_N)) \\
= \prod\limits_{i=1}^N P(X_i|Pa(X_i))$$$
$$$Pa(X_i)$$$: parent node of $$$X_i$$$ node, cause
$$$X_i$$$: child node, result
================================================================================
* Example of Bayesian network
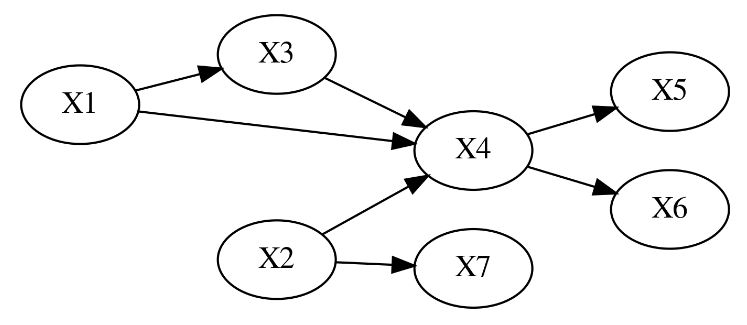 Joint probability distribution of random variables $$$(X_1,X_2,X_3,X_4,X_5,X_6,X_7)$$$
$$$P(X_1, X_2, X_3, X_4, X_5, X_6, X_7) \\
= P(X_1) P(X_2) P(X_3 | X_1) P(X_4| X_2, X_3) P(X_5|X_4) P(X_6|X_4) P(X_7|X_2)$$$
================================================================================
Important point when you create Bayesian network is
that "conditional independence relationship" between "random variables"
should show in the graph
================================================================================
* "Conditional independence" should have random variable as being used condition
================================================================================
* "Independence" between random variable A and B
$$$P(A,B)=P(A)\times P(B)$$$
$$$A\perp B|\phi$$$
================================================================================
* "Conditional independence"
$$$P(A,B|C)=P(A|C)\times P(B|C)$$$
* C: random variable as condition
* When C is given, A and B are independent
* $$$A\perp B|C$$$
================================================================================
* Separating direction is the way you can inspect
whether 2 random variables are "conditional independent" or not
* To use this, you should know following 3 relationships
1. Tail-tail binding
2. Head-tail binding
3. Head-head binding
================================================================================
* Tail-tail binding
Joint probability distribution of random variables $$$(X_1,X_2,X_3,X_4,X_5,X_6,X_7)$$$
$$$P(X_1, X_2, X_3, X_4, X_5, X_6, X_7) \\
= P(X_1) P(X_2) P(X_3 | X_1) P(X_4| X_2, X_3) P(X_5|X_4) P(X_6|X_4) P(X_7|X_2)$$$
================================================================================
Important point when you create Bayesian network is
that "conditional independence relationship" between "random variables"
should show in the graph
================================================================================
* "Conditional independence" should have random variable as being used condition
================================================================================
* "Independence" between random variable A and B
$$$P(A,B)=P(A)\times P(B)$$$
$$$A\perp B|\phi$$$
================================================================================
* "Conditional independence"
$$$P(A,B|C)=P(A|C)\times P(B|C)$$$
* C: random variable as condition
* When C is given, A and B are independent
* $$$A\perp B|C$$$
================================================================================
* Separating direction is the way you can inspect
whether 2 random variables are "conditional independent" or not
* To use this, you should know following 3 relationships
1. Tail-tail binding
2. Head-tail binding
3. Head-head binding
================================================================================
* Tail-tail binding
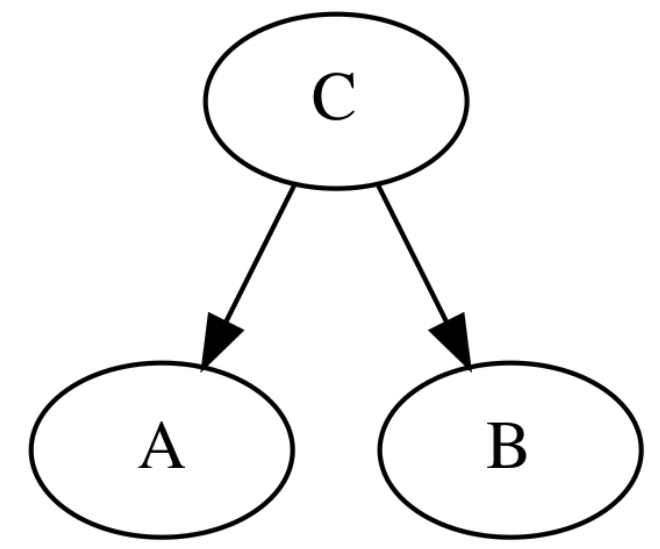 * C is tail-tail binding
* A and B are not independent
* A and B are conditional independent with respect to C
$$$P(A,B|C)\\
= \dfrac{P(A, B, C)}{P(C)}\\
= \dfrac{P(A|C)P(B|C)P(C)}{P(C)}\\
= P(A|C)P(B|C)$$$
You can call this status as "C blocks between of A and B"
================================================================================
* Tail-head binding
* C is tail-tail binding
* A and B are not independent
* A and B are conditional independent with respect to C
$$$P(A,B|C)\\
= \dfrac{P(A, B, C)}{P(C)}\\
= \dfrac{P(A|C)P(B|C)P(C)}{P(C)}\\
= P(A|C)P(B|C)$$$
You can call this status as "C blocks between of A and B"
================================================================================
* Tail-head binding
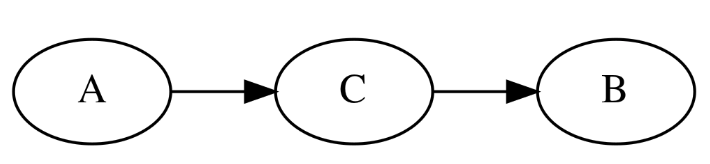 * A and B have casual relationship
* Between A and B, C is inserted
* There is a meeting of tail and heal in C
* A and B are not independent
* A and B are conditional independent wrt C
$$$P(A,B|C) \\
= \dfrac{P(A, B, C)}{P(C)}\\
= \dfrac{P(A)P(C|A)P(B|C)}{P(C)}\\
= \dfrac{P(A,C)P(B|C)}{P(C)}\\
= P(A|C)P(B|C)$$$
You can call this status as "C blocks between of A and B"
================================================================================
Head-head binding (V structure)
* A and B have casual relationship
* Between A and B, C is inserted
* There is a meeting of tail and heal in C
* A and B are not independent
* A and B are conditional independent wrt C
$$$P(A,B|C) \\
= \dfrac{P(A, B, C)}{P(C)}\\
= \dfrac{P(A)P(C|A)P(B|C)}{P(C)}\\
= \dfrac{P(A,C)P(B|C)}{P(C)}\\
= P(A|C)P(B|C)$$$
You can call this status as "C blocks between of A and B"
================================================================================
Head-head binding (V structure)
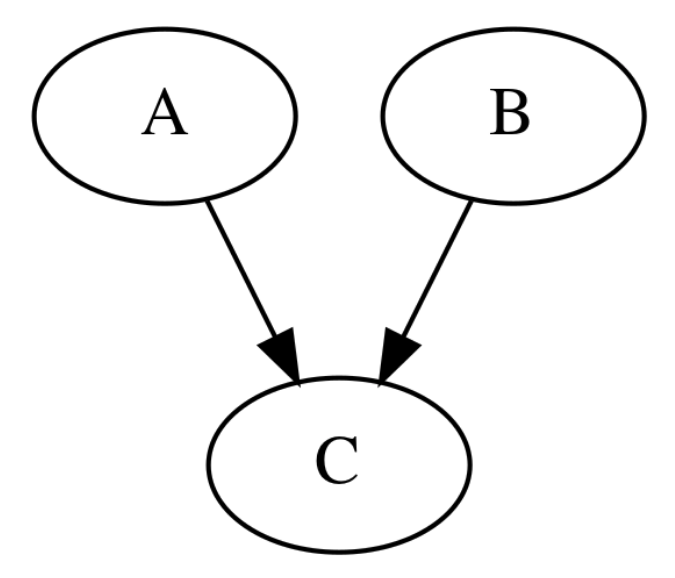 * Parenet nodes of C: A and B
* A and B are independent
$$$P(A,B,C) = P(A)P(B)P(C|A,B)$$$
$$$P(A,B) = \sum_c P(A)P(B)P(C|A,B) = P(A)P(B)$$$
* But A and B are NOT conditional independent
For example, suppose A: overslept, B: traffic jam, C: lateness
Overselpt and traffic jam are independet
* When C is given, A and B have negative correlation relationship
That is, when lateness is occurred,
if you didn't overslept, probability of traffic jam occuring increases
* This situation is called "explaining-out"
================================================================================
Head-head binding which has further descendent
* Parenet nodes of C: A and B
* A and B are independent
$$$P(A,B,C) = P(A)P(B)P(C|A,B)$$$
$$$P(A,B) = \sum_c P(A)P(B)P(C|A,B) = P(A)P(B)$$$
* But A and B are NOT conditional independent
For example, suppose A: overslept, B: traffic jam, C: lateness
Overselpt and traffic jam are independet
* When C is given, A and B have negative correlation relationship
That is, when lateness is occurred,
if you didn't overslept, probability of traffic jam occuring increases
* This situation is called "explaining-out"
================================================================================
Head-head binding which has further descendent
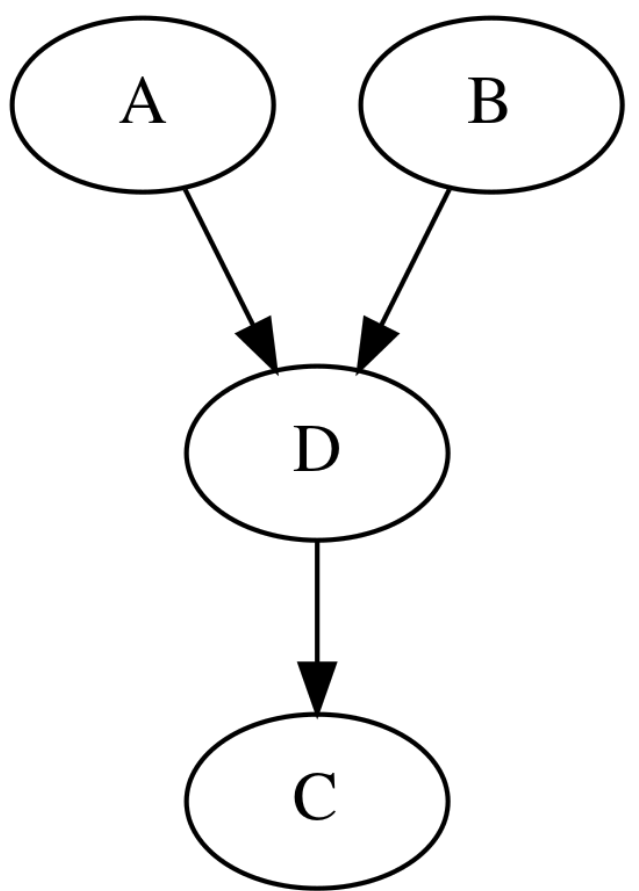 * Same characteristics with head-head binding
================================================================================
D-separation
* If A and B are conditional independent wrt C, following should be satisfied,
* C is "tail-tail binding" or "tail-head binding" in between A and B
(C blocks A and B)
* C shouldn't have "head-head binding" between A and B
================================================================================
* Bayesian network model $$$\subset$$$ Graphical probability model
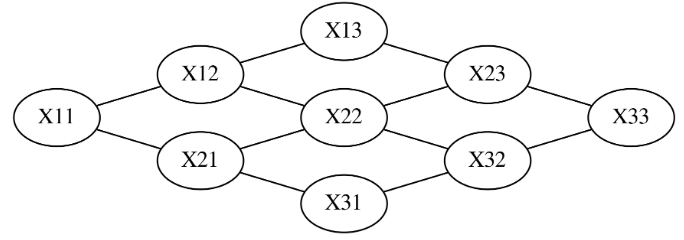
* Markov network $$$\subset$$$ Graphical probability model
* Markov network is "undirected graph"
* There are 9 random variables
* At least all 2 random variables have "relatioinship"
* Same characteristics with head-head binding
================================================================================
D-separation
* If A and B are conditional independent wrt C, following should be satisfied,
* C is "tail-tail binding" or "tail-head binding" in between A and B
(C blocks A and B)
* C shouldn't have "head-head binding" between A and B
================================================================================
* Bayesian network model $$$\subset$$$ Graphical probability model
* Markov network $$$\subset$$$ Graphical probability model
* Markov network is "undirected graph"
* There are 9 random variables
* At least all 2 random variables have "relatioinship"
 ================================================================================
* "Markov network" is composed of "cliques"
* "Clique" is composed of "random variable"
* "Distribution of random variable" for clique is represented
by "potential function" or "factor"
* "Factor" is a function which is multiplied by "positive constant"
on "joint probability distribution"
* There is no limitation (to Markov network)
that sum of all probabilities should be 1
================================================================================
"Joint probability distribution" of "Markov network" is represented
by multiplication of "factors of all cliques"
$$$P(X) \\
= \dfrac{1}{Z(X)} \{\psi_1(X_1) \times \psi_2(X_2) \times \cdots \times \psi_C(X_C)\} \\
= \dfrac{1}{Z(X)} \prod\limits_{\{C\}}\psi_C(X_C)$$$
$$$C$$$: one clique
$$$X_C$$$: random variable in each clique
$$$\psi_C$$$: factor of clique
$$$\{C\}$$$: set of all cliques
$$$Z$$$: partiaion function
================================================================================
* Suppose you have 3x3 image
3x3 image has 9 random variables
* Joint probability distribution of above 9 random variables can be represented
by using Markov network
$$$P(X_{11}, \ldots, X_{33}) =
\dfrac{1}{Z}
\psi(X_{11}, X_{12})
\psi(X_{11}, X_{21})
\psi(X_{12}, X_{13})
\cdots
\psi(X_{23}, X_{33})
\psi(X_{32}, X_{33})$$$
================================================================================
* Factor functions
$$$\psi(X) = \exp(-E(X))$$$
* $$$E(X)$$$: energy function
* Higher probability, value of energy function lower
================================================================================
* Bernoulli random variable $$$X_1, X_2$$$, which can have 0 or 1
* Let's express $$$X_1, X_2$$$ by using energy function
$$$E(X_1, X_2) = -3(2X_1 - 1)(2X_2 - 1)$$$
* Let's calculate value of factors
$$$\psi(X_1=1,X_2=1)=e^{3}$$$
$$$\psi(X_1=0,X_2=0)=e^{3}$$$
$$$\psi(X_1=1,X_2=0)=e^{-3}$$$
$$$\psi(X_1=0,X_2=1)=e^{-3}$$$
* Probability of $$$X_1$$$ and $$$X_2$$$ have sample values
> Probability of $$$X_1$$$ and $$$X_2$$$ have different values
* That is, $$$X_1$$$ and $$$X_2$$$ have positive correlation relationship
================================================================================
* "Markov network" is composed of "cliques"
* "Clique" is composed of "random variable"
* "Distribution of random variable" for clique is represented
by "potential function" or "factor"
* "Factor" is a function which is multiplied by "positive constant"
on "joint probability distribution"
* There is no limitation (to Markov network)
that sum of all probabilities should be 1
================================================================================
"Joint probability distribution" of "Markov network" is represented
by multiplication of "factors of all cliques"
$$$P(X) \\
= \dfrac{1}{Z(X)} \{\psi_1(X_1) \times \psi_2(X_2) \times \cdots \times \psi_C(X_C)\} \\
= \dfrac{1}{Z(X)} \prod\limits_{\{C\}}\psi_C(X_C)$$$
$$$C$$$: one clique
$$$X_C$$$: random variable in each clique
$$$\psi_C$$$: factor of clique
$$$\{C\}$$$: set of all cliques
$$$Z$$$: partiaion function
================================================================================
* Suppose you have 3x3 image
3x3 image has 9 random variables
* Joint probability distribution of above 9 random variables can be represented
by using Markov network
$$$P(X_{11}, \ldots, X_{33}) =
\dfrac{1}{Z}
\psi(X_{11}, X_{12})
\psi(X_{11}, X_{21})
\psi(X_{12}, X_{13})
\cdots
\psi(X_{23}, X_{33})
\psi(X_{32}, X_{33})$$$
================================================================================
* Factor functions
$$$\psi(X) = \exp(-E(X))$$$
* $$$E(X)$$$: energy function
* Higher probability, value of energy function lower
================================================================================
* Bernoulli random variable $$$X_1, X_2$$$, which can have 0 or 1
* Let's express $$$X_1, X_2$$$ by using energy function
$$$E(X_1, X_2) = -3(2X_1 - 1)(2X_2 - 1)$$$
* Let's calculate value of factors
$$$\psi(X_1=1,X_2=1)=e^{3}$$$
$$$\psi(X_1=0,X_2=0)=e^{3}$$$
$$$\psi(X_1=1,X_2=0)=e^{-3}$$$
$$$\psi(X_1=0,X_2=1)=e^{-3}$$$
* Probability of $$$X_1$$$ and $$$X_2$$$ have sample values
> Probability of $$$X_1$$$ and $$$X_2$$$ have different values
* That is, $$$X_1$$$ and $$$X_2$$$ have positive correlation relationship