- Keywords:
Normal distribution
Central limit theorem
The reason that gaussian distribution is much used
Relationship between pattern of covariance and data's distribution
================================================================================
Since Gaussian probability distribution is very much used,
Gaussian probability distribution is also alternatively called normal distribution
================================================================================
The reason that Gaussian distribution is much used:
- When you use 1D feature vector like $$$x=[170,160,180]$$$ representing height values
only 2 parameters are enough to define normal distribution; mean $$$\mu$$$ and std $$$\sigma$$$
- Due to central limit theorem
- There are many cases where you need to use Gaussian distribution
================================================================================
Central limit theorem
- Suppose mean $$$\mu$$$, variance $$$\sigma^2$$$ of population.
- Since it's difficult to analyze entire population, you extract sample from population.
- As size of sample becomes bigger and bigger,
that sample becomes data which has $$$\mu$$$ and $$$\frac{\sigma^2}{N}$$$
which represent statistical values of population
* Code
mean_of_pop=mean(population_data)
variance_of_pop=variance(population_data)
mean_of_sample=mean(large_sample_from_pop)
variance_of_sample=variance(large_sample_from_pop)
If n is enough big,
mean_of_pop $$$\approx$$$ mean_of_sample
variance_of_pop $$$\approx$$$ variance_of_sample
================================================================================
* Example
* Suppose you want to predict average height of entire population.
* You would extract sample (people).
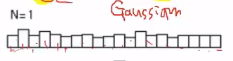
* Suppose you extract 1 person and you calculate average height of that person
Then, you will get this distribution
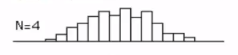
 * Suppose you extract 4 people and you calculate average height of that people
Then, you will get this distribution
* Suppose you extract 4 people and you calculate average height of that people
Then, you will get this distribution
 * Suppose you extract 7 people and you calculate average height of that people
Then, you will get this distribution
* Suppose you extract 7 people and you calculate average height of that people
Then, you will get this distribution
 * Suppose you extract 10 people and you calculate average height of that people
Then, you will get this distribution
* Suppose you extract 10 people and you calculate average height of that people
Then, you will get this distribution
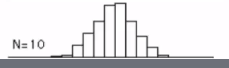 * As you increase size of sample, distribution becomes Gaussian distribution more and more.
================================================================================
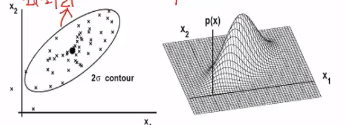
* Multivariate Gaussian probability distribution function
$$$f_X(x)= \dfrac{1}{\sqrt{2\pi}^{\frac{n}{2}} |\Sigma|^{\frac{1}{2}}} \exp \left[ -\frac{1}{2} (x-\mu)^T \Sigma^-1 (x-\mu) \right]$$$
* Shape of Gaussian probability distribution is determined
by covariance $$$\Sigma$$$ between random variables
* $$$\mu$$$ only affects the peak, not for the shape.
================================================================================
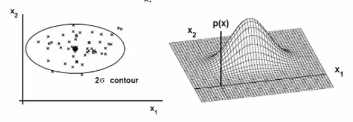
* If covariance between random variables is shaped like following
$$$\Sigma = \begin{bmatrix} \sigma_1^2&&c_{12}\\c_{12}&&\sigma_2^2 \end{bmatrix}$$$
that data which is expressed via random variables has following distribution
* As you increase size of sample, distribution becomes Gaussian distribution more and more.
================================================================================
* Multivariate Gaussian probability distribution function
$$$f_X(x)= \dfrac{1}{\sqrt{2\pi}^{\frac{n}{2}} |\Sigma|^{\frac{1}{2}}} \exp \left[ -\frac{1}{2} (x-\mu)^T \Sigma^-1 (x-\mu) \right]$$$
* Shape of Gaussian probability distribution is determined
by covariance $$$\Sigma$$$ between random variables
* $$$\mu$$$ only affects the peak, not for the shape.
================================================================================
* If covariance between random variables is shaped like following
$$$\Sigma = \begin{bmatrix} \sigma_1^2&&c_{12}\\c_{12}&&\sigma_2^2 \end{bmatrix}$$$
that data which is expressed via random variables has following distribution
 ================================================================================
* If covariance between random variables has following shape
$$$\Sigma = \begin{bmatrix} \sigma_1^2&&0\\0&&\sigma_2^2 \end{bmatrix}$$$
* $$$0$$$: correlation of data has none
* $$$\sigma_1^2 > \sigma_2^2$$$
data has following distribution
================================================================================
* If covariance between random variables has following shape
$$$\Sigma = \begin{bmatrix} \sigma_1^2&&0\\0&&\sigma_2^2 \end{bmatrix}$$$
* $$$0$$$: correlation of data has none
* $$$\sigma_1^2 > \sigma_2^2$$$
data has following distribution
 ================================================================================
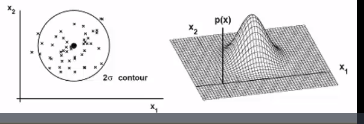
* If covariance between random variables has following shape
$$$\Sigma = \begin{bmatrix} \sigma^2&&0\\0&&\sigma^2 \end{bmatrix}$$$
* $$$0$$$: correlation of data has none
* $$$\sigma^2 = \sigma^2$$$
data has following distribution
================================================================================
* If covariance between random variables has following shape
$$$\Sigma = \begin{bmatrix} \sigma^2&&0\\0&&\sigma^2 \end{bmatrix}$$$
* $$$0$$$: correlation of data has none
* $$$\sigma^2 = \sigma^2$$$
data has following distribution
 ================================================================================