This is note I wrote as I was take following lecture
http://www.kocw.net/home/search/kemView.do?kemId=1189957
================================================================================
* Suppose there are parameters $$$\theta=[\theta_1,\cdots,\theta_N]^T$$$
which consist of "one" PDF $$$p(x|\theta)$$$
* $$$p(x|\theta)$$$: Probability density function which has above N number of parameters $$$\theta$$$
* $$$X=\{x_1,x_2,\cdots,x_N\}$$$:
sampled data which is extracted from population
which has probability density function $$$p(x|\theta)$$$
* Suppose your goal where you should find parameters $$$\theta=[\theta_1,\cdots,\theta_N]^T$$$
(like mean of height from 10 people: $$$\theta_1$$$, variance of height from 10 people: $$$\theta_2$$$)
via above sample $$$X=\{x_1,x_2,\cdots,x_N\}$$$
* To inference those parameters, you can use Maximum Likelihood Estimation
================================================================================
$$$p(X|\theta) \\
= p(x_1|\theta) \times p(x_2|\theta) \times \cdots \times p(x_N|\theta) \\
= \prod\limits_{k=1}^{N} p(x_k|\theta)$$$
* $$$p(X|\theta)$$$: likelihood PDF
================================================================================
* For simplicity on calculation,
you can convert above multiplication form to summation form of likelihood PDF $$$p(X|\theta)$$$
* Multiplication version:
$$$\hat{\theta} = \arg_\theta \max[p(X|\theta)]$$$
* Find argument $$$\hat{\theta}$$$ which maximizes likelihood $$$p(X|\theta)$$$
* Log version
$$$\hat{\theta} \\
= \arg_\theta \max[ \log{p(X|\theta)}] \\
= \arg_\theta \max[ \log{ p(x_1|\theta) p(x_2|\theta) \cdots p(x_N|\theta) }] \\
= \arg_\theta \max[ \log{p(x_1|\theta)} + \log{p(x_2|\theta)} + \cdots + \log{p(x_N|\theta)} ] $$$
================================================================================
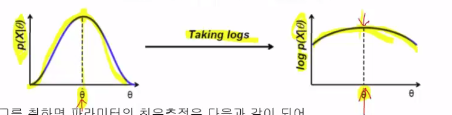
* Why you should use "log-likelihood" by using log_likelihood=log_func(likelihood)
* Following is true even if log-applied-equation is simpler for calculation
$$$\hat{\theta}=\arg_{\theta}\max [p(X|\theta)] = \arg_{\theta}\max [ \log{p(X|\theta)} ]$$$
================================================================================
Characteristic of log-applied function
 1. Log function is monotonic function
$$$\hat{\theta} \\
= \arg_{\theta}\max [ \log \prod\limits_{k=1}^{N} p(x_k|\theta) ] \\
= \arg_{\theta}\max [ \sum\limits_{k=1}^{N} \log p(x_k|\theta) ] $$$
2. If distribution is Gaussian, equation becomes simple by following rule
$$$\log[Ae^{-B}]=\log{A}+ \log{e^{-B}} = \log{A}+ -B$$$
================================================================================
* Univariate Gaussian which has one kind of feature like height
* PDF $$$p(x)=N(\mu,\sigma)$$$
* $$$N(\mu,\sigma)$$$: normal distribution
* Given data $$$X=\{x_1,x_2,\cdots,x_N\}$$$
* You goal is to find $$$\hat{\theta}$$$
$$$\hat{\theta}
=\arg_{\theta}\max \sum\limits_{k=1}^{N} \log{ p(x_k|\theta)}$$$
================================================================================
* Since you suppose Gaussian distribution $$$N(\mu,\sigma)=\frac{1}{\sqrt{2\pi}\sigma} e^{-\frac{1}{2}\cdot \frac{X-\mu}{\sigma^2} }$$$
as shape of population, Put $$$X^K$$$ into $$$X$$$
$$$\hat{\theta}
=\arg_{\theta}\max \sum\limits_{k=1}^{N} \log{ \left( \frac{1}{\sqrt{2\pi}\sigma} \exp \left( -\frac{1}{2\sigma^2} (x_k-\mu) \right)^2 \right) }$$$
* Use $$$\log{[Ae^{-B}]}=\log{A}-B$$$
$$$\hat{\theta}
=\arg_{\theta}\max \sum\limits_{k=1}^{N} \left\{ \log{(\frac{1}{\sqrt{2\pi}\sigma})} - \frac{1}{2\sigma^2} (x_k-\mu)^2 \right\}$$$
================================================================================
* Minimum or maximum values are located at the location satisfying differentiation=0
$$$\dfrac{\partial}{\partial \mu} \sum\limits_{k=1}^{N} \left\{ \log{(\frac{1}{\sqrt{2\pi}\sigma})} - \frac{1}{2\sigma^2} (x_k-\mu)^2 \right\}$$$
================================================================================
* Simplify above equation and you will get folliwng conclusive formular:
* $$$\mu = \frac{1}{N} \sum\limits_{k=1}^{N} x_k$$$
* You have induced above formula
which can inference parameter $$$\mu$$$ via sampled data by yourself
by using MLE method and sampled data
* Meaning
1. Suppose you don't know the mean value of puplation data
2. You will inference proper parameter such as mean value
3. by using sampled data
4. by using Maximum Likelihood Estimation method
5. then, you can obtain a formula
and it's formula which you had already known
and which you used to calculate mean value of sample and population's mean value
================================================================================
* When you deal with Univariate Gaussian,
what you should find is $$$\mu$$$ for peak and $$$\sigma$$$ for width
to determine the shape of Gaussian distribution
* PDF $$$p(x)=N(\mu,\sigma)$$$
* Given data $$$X=\{x_1,x_2,\cdots,x_N\}$$$
* Your goal is to inference parameters $$$\mu$$$ and $$$\sigma$$$ by using MLE
* Code
mean,variance=maximum_likelihood_estimation(sampled_data)
* Since variable is 2 kinds; $$$\mu$$$ and $$$\sigma$$$,
"differentiation" becomes "gradient" (or "partial derivative") than "differentiation"
================================================================================
$$$\hat{\theta}= \begin{bmatrix} \theta_1=\mu\\\theta_2=\sigma^2 \end{bmatrix}$$$
Perform gradient $$$\triangledown$$$ wrt $$$\theta_1$$$ and $$$\theta_2$$$
$$$\triangledown_{\theta} \\
= \begin{bmatrix} \frac{\partial}{\partial \theta_1} \sum\limits_{k=1}^{N} \log p(x_k|\theta)\\\frac{\partial}{\partial \theta_2} \sum\limits_{k=1}^{N} \log p(x_k|\theta) \end{bmatrix} \\
= \begin{bmatrix} \frac{1}{\theta_2} (x_k-\theta_1)\\-\frac{1}{2 \theta_2} + \frac{(x_k-\theta_1)^2}{2\theta_2^2} \end{bmatrix} \\
= 0$$$
================================================================================
* Simplify above equation wrt $$$\theta_1$$$ and $$$\theta_2$$$
* $$$\hat{\theta}_1 = \frac{1}{N} \sum\limits_{k=1}^{N} x_k$$$
* $$$\hat{\theta}_2 = \frac{1}{N} \sum\limits_{k=1}^{N} (x_k - \hat{\theta}_1)^2$$$
================================================================================
* Conclusion:
* First step what you should do is
to suppose shape of population's probability distribution is Gaussian distribution
* Then, find best mean and variance of that Gaussian distribution by using MLE
* Code
mean,variance=MLE(sampled_data)
* You can induce mean and variance fomulas
================================================================================
* In the case of you deal with multivariate Gaussian distribution
* Mean: mean vector
* Variance: covariance matrix
1. Log function is monotonic function
$$$\hat{\theta} \\
= \arg_{\theta}\max [ \log \prod\limits_{k=1}^{N} p(x_k|\theta) ] \\
= \arg_{\theta}\max [ \sum\limits_{k=1}^{N} \log p(x_k|\theta) ] $$$
2. If distribution is Gaussian, equation becomes simple by following rule
$$$\log[Ae^{-B}]=\log{A}+ \log{e^{-B}} = \log{A}+ -B$$$
================================================================================
* Univariate Gaussian which has one kind of feature like height
* PDF $$$p(x)=N(\mu,\sigma)$$$
* $$$N(\mu,\sigma)$$$: normal distribution
* Given data $$$X=\{x_1,x_2,\cdots,x_N\}$$$
* You goal is to find $$$\hat{\theta}$$$
$$$\hat{\theta}
=\arg_{\theta}\max \sum\limits_{k=1}^{N} \log{ p(x_k|\theta)}$$$
================================================================================
* Since you suppose Gaussian distribution $$$N(\mu,\sigma)=\frac{1}{\sqrt{2\pi}\sigma} e^{-\frac{1}{2}\cdot \frac{X-\mu}{\sigma^2} }$$$
as shape of population, Put $$$X^K$$$ into $$$X$$$
$$$\hat{\theta}
=\arg_{\theta}\max \sum\limits_{k=1}^{N} \log{ \left( \frac{1}{\sqrt{2\pi}\sigma} \exp \left( -\frac{1}{2\sigma^2} (x_k-\mu) \right)^2 \right) }$$$
* Use $$$\log{[Ae^{-B}]}=\log{A}-B$$$
$$$\hat{\theta}
=\arg_{\theta}\max \sum\limits_{k=1}^{N} \left\{ \log{(\frac{1}{\sqrt{2\pi}\sigma})} - \frac{1}{2\sigma^2} (x_k-\mu)^2 \right\}$$$
================================================================================
* Minimum or maximum values are located at the location satisfying differentiation=0
$$$\dfrac{\partial}{\partial \mu} \sum\limits_{k=1}^{N} \left\{ \log{(\frac{1}{\sqrt{2\pi}\sigma})} - \frac{1}{2\sigma^2} (x_k-\mu)^2 \right\}$$$
================================================================================
* Simplify above equation and you will get folliwng conclusive formular:
* $$$\mu = \frac{1}{N} \sum\limits_{k=1}^{N} x_k$$$
* You have induced above formula
which can inference parameter $$$\mu$$$ via sampled data by yourself
by using MLE method and sampled data
* Meaning
1. Suppose you don't know the mean value of puplation data
2. You will inference proper parameter such as mean value
3. by using sampled data
4. by using Maximum Likelihood Estimation method
5. then, you can obtain a formula
and it's formula which you had already known
and which you used to calculate mean value of sample and population's mean value
================================================================================
* When you deal with Univariate Gaussian,
what you should find is $$$\mu$$$ for peak and $$$\sigma$$$ for width
to determine the shape of Gaussian distribution
* PDF $$$p(x)=N(\mu,\sigma)$$$
* Given data $$$X=\{x_1,x_2,\cdots,x_N\}$$$
* Your goal is to inference parameters $$$\mu$$$ and $$$\sigma$$$ by using MLE
* Code
mean,variance=maximum_likelihood_estimation(sampled_data)
* Since variable is 2 kinds; $$$\mu$$$ and $$$\sigma$$$,
"differentiation" becomes "gradient" (or "partial derivative") than "differentiation"
================================================================================
$$$\hat{\theta}= \begin{bmatrix} \theta_1=\mu\\\theta_2=\sigma^2 \end{bmatrix}$$$
Perform gradient $$$\triangledown$$$ wrt $$$\theta_1$$$ and $$$\theta_2$$$
$$$\triangledown_{\theta} \\
= \begin{bmatrix} \frac{\partial}{\partial \theta_1} \sum\limits_{k=1}^{N} \log p(x_k|\theta)\\\frac{\partial}{\partial \theta_2} \sum\limits_{k=1}^{N} \log p(x_k|\theta) \end{bmatrix} \\
= \begin{bmatrix} \frac{1}{\theta_2} (x_k-\theta_1)\\-\frac{1}{2 \theta_2} + \frac{(x_k-\theta_1)^2}{2\theta_2^2} \end{bmatrix} \\
= 0$$$
================================================================================
* Simplify above equation wrt $$$\theta_1$$$ and $$$\theta_2$$$
* $$$\hat{\theta}_1 = \frac{1}{N} \sum\limits_{k=1}^{N} x_k$$$
* $$$\hat{\theta}_2 = \frac{1}{N} \sum\limits_{k=1}^{N} (x_k - \hat{\theta}_1)^2$$$
================================================================================
* Conclusion:
* First step what you should do is
to suppose shape of population's probability distribution is Gaussian distribution
* Then, find best mean and variance of that Gaussian distribution by using MLE
* Code
mean,variance=MLE(sampled_data)
* You can induce mean and variance fomulas
================================================================================
* In the case of you deal with multivariate Gaussian distribution
* Mean: mean vector
* Variance: covariance matrix