13-01 LDA(linear discriminant analysis)
===========================================================
PCA, LDA, both are algorithms for dimensionality reduction.
@
PCA : reduces dimensionality with keeping characteristics of data in high dimension
is much used in case that you don't use multi class
more precisely, you reduce dimensionality on each class (each data)
LDA : reduces dimensionality with purpose of optimal classification in low (reduced) dimension
keeps information of discriminant of data
is applied on entire data
===========================================================
D dimension sample data set $$$X = \{x^{(1)}, ..., x^{(N)}\}$$$
Number of sample involved in $$$\omega_{1}$$$ class is $$$N_{1}$$$
Number of sample involved in $$$\omega_{2}$$$ class is $$$N_{2}$$$
That is, data X is sample mixed with 2 classes data
=========================================================
When you want to obtain scalar y by performing projection of x along specific line (axis),
you can use following inner product formular, resulting in projected vector :
$$$y = W^{T}x$$$
$$$W^{T}$$$ is matrix which has column vectors which have projection direction you want to use when performing projecion
@
There can be numorous lines (axises) which have direction you want to project vector data
Out of all possible lines (axises),
purpose of LDA is to find lines (axises) which make classification of scalar values (projected data) most easy
=========================================================
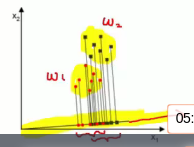
Suppose you have 2 dimension input data
Red dots are $$$w_{1}$$$ class data
Blue dots are $$$w_{2}$$$ class data
You can project 2 dimension data onto one line (axis, vector)
Following picture shows PCA
2018-06-07 09-18-03.png
 =========================================================
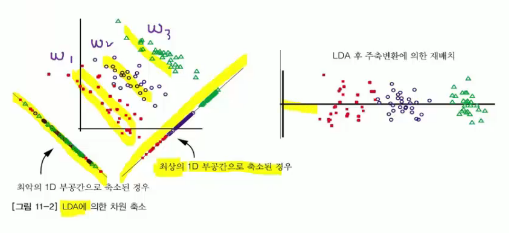
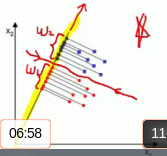
Result distribution after projection can show differ according to kind of 1 dimension line (axis, vector)
Some lines make classification of projected data easier
Methodology to find direction of these lines (which make classification of projected data easier) is LDA
2018-06-07 09-22-53.png
=========================================================
Result distribution after projection can show differ according to kind of 1 dimension line (axis, vector)
Some lines make classification of projected data easier
Methodology to find direction of these lines (which make classification of projected data easier) is LDA
2018-06-07 09-22-53.png
 =========================================================
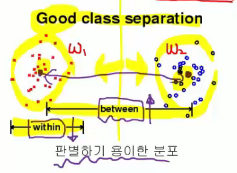
LDA reduces dimensionality of high dimensional feature vector data
by maximizing ratio between "variance between classes" and "variance within class"
Small variance within class (==within-class scatter) :
high density data in each class
Large variance between class (==between-class scatter) :
far between each class centroid
clear classification between classes
small variance within class
large variance between class
good example for class separation
2018-06-07 09-32-23.png
=========================================================
LDA reduces dimensionality of high dimensional feature vector data
by maximizing ratio between "variance between classes" and "variance within class"
Small variance within class (==within-class scatter) :
high density data in each class
Large variance between class (==between-class scatter) :
far between each class centroid
clear classification between classes
small variance within class
large variance between class
good example for class separation
2018-06-07 09-32-23.png
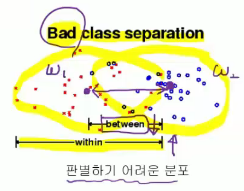
 large variance within class
small variance between class
bad example for class separation
2018-06-07 09-32-37.png
large variance within class
small variance between class
bad example for class separation
2018-06-07 09-32-37.png
 =========================================================
Mathematically, $$$\frac{\text{between-class Scatter}}{\text{within-class Scatter}}$$$
large $$$value = \frac{large}{small}$$$
good example for class separation
high density within class
far distance between centroids of classes
small $$$value = \frac{small}{large}$$$
bad example for class separation
low density within class
short distance between centroids of classes
Finding large $$$value = \frac{large}{small}$$$ is goal of LDA
=========================================================
2018-06-07 09-38-39.png
=========================================================
Mathematically, $$$\frac{\text{between-class Scatter}}{\text{within-class Scatter}}$$$
large $$$value = \frac{large}{small}$$$
good example for class separation
high density within class
far distance between centroids of classes
small $$$value = \frac{small}{large}$$$
bad example for class separation
low density within class
short distance between centroids of classes
Finding large $$$value = \frac{large}{small}$$$ is goal of LDA
=========================================================
2018-06-07 09-38-39.png