001-002. reason we use python, pandas, pivot_table(), dataframe.plot("title")
# @
# %matplotlib inline
import pandas as pd
# Load NationalNames.csv file with designating header name
names=pd.read_csv("/media/young/5e7be152-8ed5-483d-a8e8-b3fecfa221dc/NationalNames.csv",
header=0,names=["id","name","year","sex","births"])
names.head()
# id name year sex births
# 0 1 Mary 1880 F 7065
# 1 2 Anna 1880 F 2604
# 2 3 Emma 1880 F 2003
# 3 4 Elizabeth 1880 F 1939
# 4 5 Minnie 1880 F 1746
names.count()
# id 1825433
# name 1825433
# year 1825433
# sex 1825433
# births 1825433
total_births=names.pivot_table("births",index="year",columns="sex",aggfunc=sum)
total_births.head(10)
# sex F M
# year
# 1880 90993 110491
# 1881 91954 100745
# 1882 107850 113688
# 1883 112321 104629
# 1884 129022 114445
# 1885 133055 107800
# 1886 144535 110784
# 1887 145982 101414
# 1888 178627 120853
# 1889 178366 110584
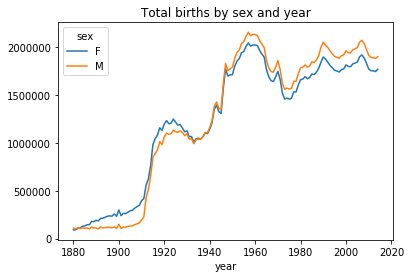
# total_births is dataframe
total_births.plot(title="Total births by sex and year")
# img bc18ad77-eb2e-4ccb-bf7f-1e1d475aafbf