005-002. advanced features of matplotlib
# @
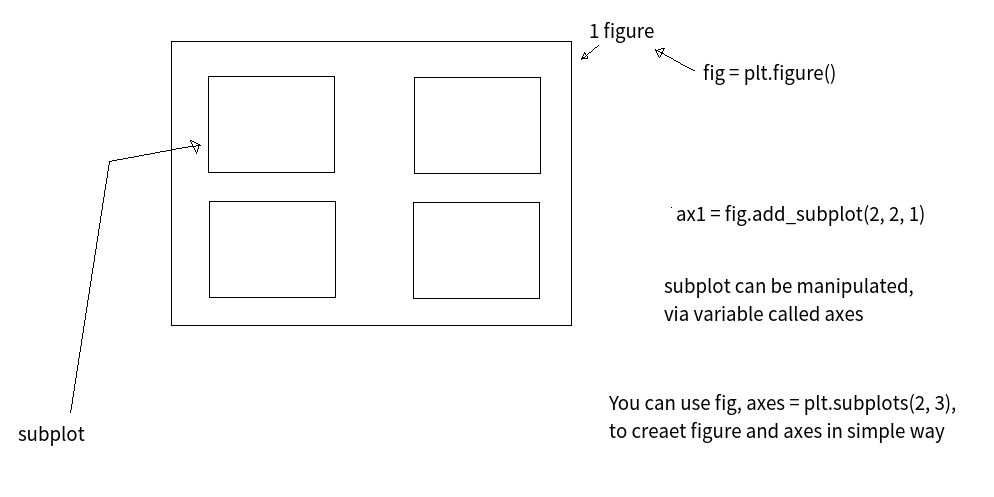
# matplotlib uses unit of drawing named "figure",
# and you can draw one subplot or multiple subplots in one "figure"
# img 45e5dc6a-e2d2-498c-ac3f-b02391473128
 # @
# When you draw line plot or bar plot,
# with dataframe.plot() or series.plot(),
# matplotlib automatically creates one figure,
# and, matplotlib inputs one subplot(line plot or bar plot) into figure
# @
# There will be case you want to use multiple subplots in one figure
# figure
# subplot
# figure
# subplot1
# subplot2
# subplot3
# @
%matplotlib nbagg
import matplotlib
import matplotlib.pyplot as plt
import numpy as np
import pandas as pd
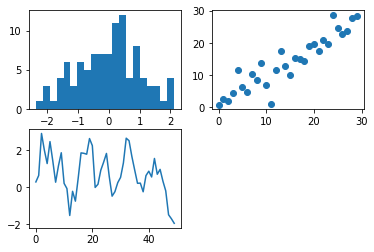
# When you want to create empty figure,
# you can use pyplot.figure()
empty_figure=plt.figure()
# You can see empty figure
# You can add subplot into empty figure
# We will use 2 subplots in width
# We will use 2 subplots in height
# We will arrange ax1 subplot in 1 position,
# 1 2
# 3 4
ax1=empty_figure.add_subplot(2,2,1)
# You can designate specific subplot
ax1.hist(np.random.randn(100),bins=20)
ax2=empty_figure.add_subplot(2,2,2)
ax2.scatter(np.arange(30),np.arange(30)+3*np.random.randn(30))
ax3=empty_figure.add_subplot(2,2,3)
# Then, you can actually draw generated subplots
# You will draw line plot
plt.plot(np.random.randn(50).cumsum())
# This code draws plot from last position
# img 6c50059c-ccf9-4cfe-bffa-3b4aa46cc0d3
# @
# When you draw line plot or bar plot,
# with dataframe.plot() or series.plot(),
# matplotlib automatically creates one figure,
# and, matplotlib inputs one subplot(line plot or bar plot) into figure
# @
# There will be case you want to use multiple subplots in one figure
# figure
# subplot
# figure
# subplot1
# subplot2
# subplot3
# @
%matplotlib nbagg
import matplotlib
import matplotlib.pyplot as plt
import numpy as np
import pandas as pd
# When you want to create empty figure,
# you can use pyplot.figure()
empty_figure=plt.figure()
# You can see empty figure
# You can add subplot into empty figure
# We will use 2 subplots in width
# We will use 2 subplots in height
# We will arrange ax1 subplot in 1 position,
# 1 2
# 3 4
ax1=empty_figure.add_subplot(2,2,1)
# You can designate specific subplot
ax1.hist(np.random.randn(100),bins=20)
ax2=empty_figure.add_subplot(2,2,2)
ax2.scatter(np.arange(30),np.arange(30)+3*np.random.randn(30))
ax3=empty_figure.add_subplot(2,2,3)
# Then, you can actually draw generated subplots
# You will draw line plot
plt.plot(np.random.randn(50).cumsum())
# This code draws plot from last position
# img 6c50059c-ccf9-4cfe-bffa-3b4aa46cc0d3
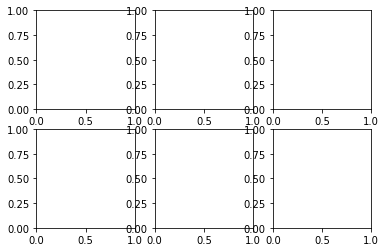
 # You can use pyplot.subplots(),
# to draw figure and subplot in easy way
# subplots(2,3) means you create one figure,
# and configure (2,3) subplots
# This method returns 2 valeus
# empty_figure is empty figure
# axes is axises of subplots
empty_figure,axes=plt.subplots(2,3)
# [[subplot,subplot,subplot],
# [subplot,subplot,subplot]]
axes[1,2].plot()
# img f73ad081-d879-403e-9cfa-84dd39227dfe
# You can use pyplot.subplots(),
# to draw figure and subplot in easy way
# subplots(2,3) means you create one figure,
# and configure (2,3) subplots
# This method returns 2 valeus
# empty_figure is empty figure
# axes is axises of subplots
empty_figure,axes=plt.subplots(2,3)
# [[subplot,subplot,subplot],
# [subplot,subplot,subplot]]
axes[1,2].plot()
# img f73ad081-d879-403e-9cfa-84dd39227dfe
 # @
# You can decorate your plots
# You draw line plot
plt.plot(np.random.randn(30),color="g",marker='o',linestyle="--")
# img 03e118eb-bf14-4b67-a3a5-16c234780dea
# @
# You can decorate your plots
# You draw line plot
plt.plot(np.random.randn(30),color="g",marker='o',linestyle="--")
# img 03e118eb-bf14-4b67-a3a5-16c234780dea
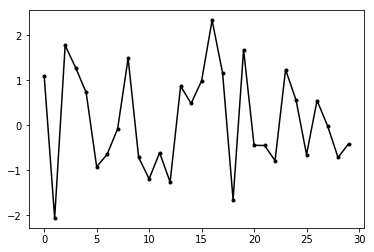
 # You can designate arguments in simple notations
# k is color
# . is marker
# - is line style
plt.plot(np.random.randn(30),"k.-")
# img 80e0c710-6052-4d43-98d3-96110177b009
# You can designate arguments in simple notations
# k is color
# . is marker
# - is line style
plt.plot(np.random.randn(30),"k.-")
# img 80e0c710-6052-4d43-98d3-96110177b009
 # @
# You create empty figure,
# and create (2,1) subplots in empty figure
empty_figure,axes=plt.subplots(2,1)
series_data=pd.Series(np.random.rand(16),index=list('abcdefghijklmnop'))
series_data.plot(kind="bar",ax=axes[0],color='k',alpha=0.7)
series_data.plot(kind="barh",ax=axes[1],color='g',alpha=0.3)
# img 6e5452f3-68b5-4bd3-ba97-4b5283d9fb5f
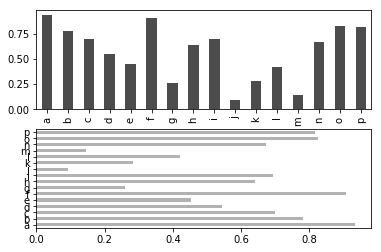
# @
# You create empty figure,
# and create (2,1) subplots in empty figure
empty_figure,axes=plt.subplots(2,1)
series_data=pd.Series(np.random.rand(16),index=list('abcdefghijklmnop'))
series_data.plot(kind="bar",ax=axes[0],color='k',alpha=0.7)
series_data.plot(kind="barh",ax=axes[1],color='g',alpha=0.3)
# img 6e5452f3-68b5-4bd3-ba97-4b5283d9fb5f
 # @
# You can designate graduation, label, legend
# You create empty figure
empty_figure=plt.figure()
# You create (1,1) subplots,
# and use 1 position
ax=empty_figure.add_subplot(1,1,1)
# We call graduation "tick"
# We call x axis graduation "xtick"
# We call y axis graduation "ytick"
# You can manipulate xtick
ticks=ax.set_xticks([0,250,500,750,1000])
# You can replace value of xtick with string
labels=ax.set_xticklabels(["one","two","three","four","five"],
rotation=30,fontsize="small")
# You can designate title of this axes(subplot)
ax.set_title("Random walk plot")
ax.set_xlabel("Stages")
ax.set_ylabel("Values")
ax.plot(np.random.randn(1000).cumsum())
# img 7c75476a-14a2-4485-a01f-96c1ccaec77e
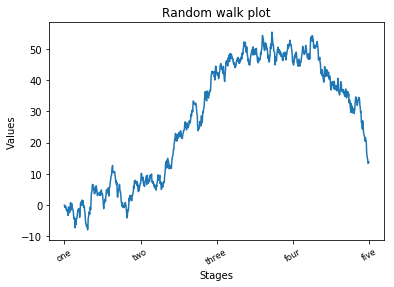
# @
# You can designate graduation, label, legend
# You create empty figure
empty_figure=plt.figure()
# You create (1,1) subplots,
# and use 1 position
ax=empty_figure.add_subplot(1,1,1)
# We call graduation "tick"
# We call x axis graduation "xtick"
# We call y axis graduation "ytick"
# You can manipulate xtick
ticks=ax.set_xticks([0,250,500,750,1000])
# You can replace value of xtick with string
labels=ax.set_xticklabels(["one","two","three","four","five"],
rotation=30,fontsize="small")
# You can designate title of this axes(subplot)
ax.set_title("Random walk plot")
ax.set_xlabel("Stages")
ax.set_ylabel("Values")
ax.plot(np.random.randn(1000).cumsum())
# img 7c75476a-14a2-4485-a01f-96c1ccaec77e
 # @
# If you have multiple plots in one axes,
# you should denote legend for each plot
# For test, first, you create new empty figure,
# and new subplot axes
empty_figure=plt.figure()
ax=empty_figure.add_subplot(1,1,1)
# You add 3 plots into one axes with designating label
ax.plot(np.random.randn(1000).cumsum(),'k',label="one")
ax.plot(np.random.randn(1000).cumsum(),"b--",label="two")
ax.plot(np.random.randn(1000).cumsum(),"r.",label="three")
# You actually denote legend based on label
# best: automatically position is set
ax.legend(loc="best")
# You can check range of x axis and y axis
ax.get_xlim()
# You can manipulate range of x axis and y axis of axes
ax.set_xlim([100,900])
ax.set_ylim([-100,100])
# img b98b65cb-ff4e-4cfc-8317-3b16cafbd3aa
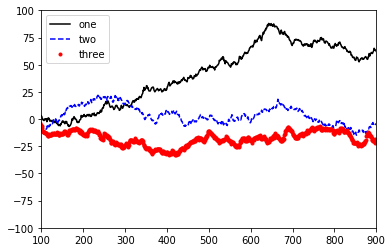
# @
# If you have multiple plots in one axes,
# you should denote legend for each plot
# For test, first, you create new empty figure,
# and new subplot axes
empty_figure=plt.figure()
ax=empty_figure.add_subplot(1,1,1)
# You add 3 plots into one axes with designating label
ax.plot(np.random.randn(1000).cumsum(),'k',label="one")
ax.plot(np.random.randn(1000).cumsum(),"b--",label="two")
ax.plot(np.random.randn(1000).cumsum(),"r.",label="three")
# You actually denote legend based on label
# best: automatically position is set
ax.legend(loc="best")
# You can check range of x axis and y axis
ax.get_xlim()
# You can manipulate range of x axis and y axis of axes
ax.set_xlim([100,900])
ax.set_ylim([-100,100])
# img b98b65cb-ff4e-4cfc-8317-3b16cafbd3aa