bikesharingdemand
# @
# 자전거 수요 예측[3/4] 캐글 머신러닝 랜덤포레스트만으로 경진대회에 참여하기
# https://www.youtube.com/watch?v=g7EwIFXJntc&t=179s
import pandas as pd
import numpy as np
import matplotlib as mpl
import matplotlib.pyplot as plt
import seaborn as sns
%matplotlib inline
# You can fix issue of broken "-" in the graph,
# with following code
mpl.rcParams['axes.unicode_minus']=False
import warnings
warnings.filterwarnings('ignore')
train_dataset_dataframe=pd.read_csv("D://chromedown//kaggle-bike//train.csv",parse_dates=["datetime"])
train_dataset_dataframe.shape
# (10886,12)
test_dataset_dataframe=pd.read_csv("D://chromedown//kaggle-bike//test.csv",parse_dates=["datetime"])
test_dataset_dataframe.shape
# (6493,9)
# You will process engineering features
# You loaded dataset as datetime type
# You want to make them detailed columns
train_dataset_dataframe["year"]=train_dataset_dataframe["datetime"].dt.year
train_dataset_dataframe["month"]=train_dataset_dataframe["datetime"].dt.month
train_dataset_dataframe["day"]=train_dataset_dataframe["datetime"].dt.day
train_dataset_dataframe["hour"]=train_dataset_dataframe["datetime"].dt.hour
train_dataset_dataframe["minute"]=train_dataset_dataframe["datetime"].dt.minute
train_dataset_dataframe["second"]=train_dataset_dataframe["datetime"].dt.second
train_dataset_dataframe["dayofweek"]=train_dataset_dataframe["datetime"].dt.dayofweek
train_dataset_dataframe.shape
# (10886,19)
test_dataset_dataframe["year"]=test_dataset_dataframe["datetime"].dt.year
test_dataset_dataframe["month"]=test_dataset_dataframe["datetime"].dt.month
test_dataset_dataframe["day"]=test_dataset_dataframe["datetime"].dt.day
test_dataset_dataframe["hour"]=test_dataset_dataframe["datetime"].dt.hour
test_dataset_dataframe["minute"]=test_dataset_dataframe["datetime"].dt.minute
test_dataset_dataframe["second"]=test_dataset_dataframe["datetime"].dt.second
test_dataset_dataframe["dayofweek"]=test_dataset_dataframe["datetime"].dt.dayofweek
test_dataset_dataframe.shape
# (6493,16)
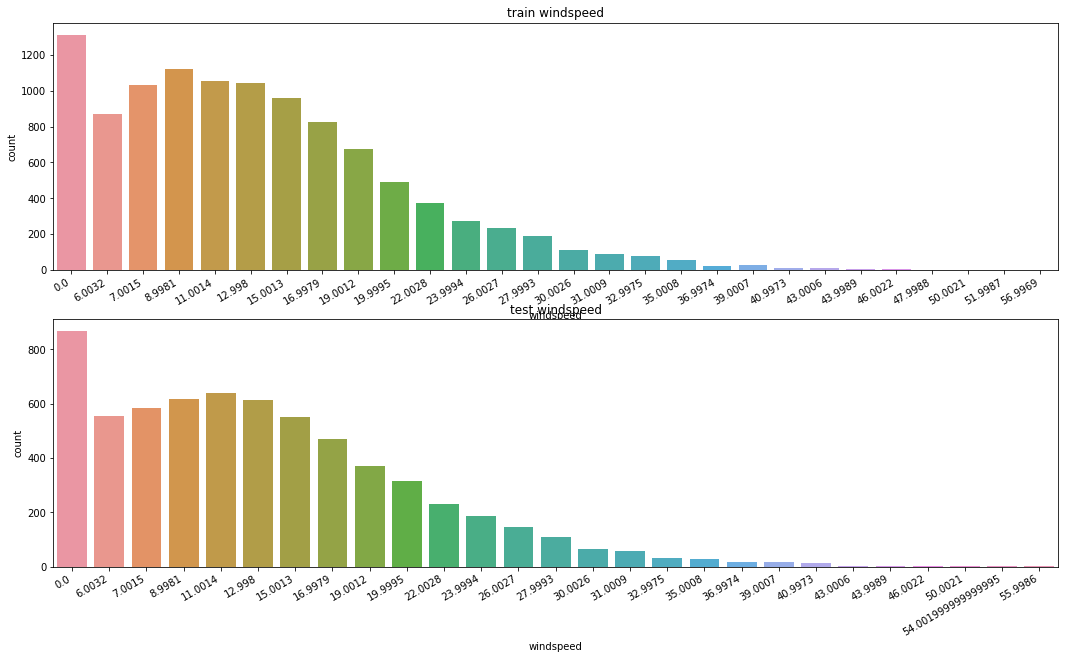
# You can visualize data
# You can see there are lots of data which have windspeed 0
# Data which have windspeed 0 might come from bad measurement,
# so you need to refine them
figure_object,subplot_object=plt.subplots(nrows=2)
figure_object.set_size_inches(18,10)
plt.sca(subplot_object[0])
plt.xticks(rotation=30,ha='right')
subplot_object[0].set(ylabel='Count',title="train windspeed")
sns.countplot(data=train_dataset_dataframe,x="windspeed",ax=subplot_object[0])
plt.sca(subplot_object[1])
plt.xticks(rotation=30,ha='right')
subplot_object[1].set(ylabel='Count',title="test windspeed")
sns.countplot(data=test_dataset_dataframe,x="windspeed",ax=subplot_object[1])
# img ed376c9c-ceeb-4ccb-9db9-e00e68a2488f.png
 # You will separate data into windspeed 0 and windspeed not 0 in train data
train_dataset_having_windspeed0=train_dataset_dataframe.loc[train_dataset_dataframe['windspeed']==0]
train_dataset_not_having_windspeed0=train_dataset_dataframe.loc[train_dataset_dataframe['windspeed']!=0]
# You can see "not windspeed 0" cases are much more than "windspeed 0" cases
train_dataset_having_windspeed0.shape
# (0,19)
train_dataset_not_having_windspeed0.shape
# (9573,19)
from sklearn.ensemble import RandomForestClassifier
def predict_windspeed(data):
data_having_windspeed0=data.loc[data['windspeed']==0]
data_not_having_windspeed0=data.loc[data['windspeed']!=0]
# You can select features for "predicting windspeed model"
weather_features_list=["season","weather","humidity","month","temp","year","atemp"]
# You will change data type of windspeed from data_not_having_windspeed0 into string to use
data_not_having_windspeed0["windspeed"]=data_not_having_windspeed0["windspeed"].astype("str")
# You will use random forest classifier
randomforest_classifier_object_for_predicting_windspeed=RandomForestClassifier()
# You're creating predicting model for windspeed
# And training data for this predicting model is,
# data composed of weather_features_list
# You want to find optimized parameters,
# (letting predicting model for windspeed to learn),
# for this predicting model
# data_not_having_windspeed0[weather_features_list] will be fearues
# data_not_having_windspeed0["windspeed"] will be label
randomforest_classifier_object_for_predicting_windspeed.fit(\
data_not_having_windspeed0[weather_features_list]\
,data_not_having_windspeed0["windspeed"])
# You let predicting model to predict windspeed
prediction_value_for_windspeed=randomforest_classifier_object_for_predicting_windspeed.predict(\
X=data_having_windspeed0[weather_features_list])
prediction_value_for_windspeed0=data_having_windspeed0
prediction_value_for_windspeed_not_0=data_not_having_windspeed0
prediction_value_for_windspeed0["windspeed"]=prediction_value_for_windspeed
merged_date=prediction_value_for_windspeed_not_0.append(prediction_value_for_windspeed0)
# You convert datatype of windspeed into float
merged_date["windspeed"]=merged_date["windspeed"].astype("float")
merged_date.reset_index(inplace=True)
merged_date.drop('index',inplace=True,axis=1)
return merged_date
# You can use predict_windspeed() with putting train data to refine windspeed 0 data
refined_train_dataset_dataframe=predict_windspeed(train_dataset_dataframe)
# test=predict_windspeed(test)
# You can visualize refined data
figure_object,subplot_object1=plt.subplots()
figure_object.set_size_inches(18,6)
plt.sca(subplot_object1)
# data label text on x axis is rotated by 30 degree
plt.xticks(rotation=30,ha='right')
subplot_object1.set(ylabel='Count',title="windspeed of refined train data")
sns.countplot(data=refined_train_dataset_dataframe,x="windspeed",ax=subplot_object1)
# You can confirm windspeed 0 data are eleminated
# img 8b961666-30dc-44e1-b03f-087b7f1d3a84
# You will separate data into windspeed 0 and windspeed not 0 in train data
train_dataset_having_windspeed0=train_dataset_dataframe.loc[train_dataset_dataframe['windspeed']==0]
train_dataset_not_having_windspeed0=train_dataset_dataframe.loc[train_dataset_dataframe['windspeed']!=0]
# You can see "not windspeed 0" cases are much more than "windspeed 0" cases
train_dataset_having_windspeed0.shape
# (0,19)
train_dataset_not_having_windspeed0.shape
# (9573,19)
from sklearn.ensemble import RandomForestClassifier
def predict_windspeed(data):
data_having_windspeed0=data.loc[data['windspeed']==0]
data_not_having_windspeed0=data.loc[data['windspeed']!=0]
# You can select features for "predicting windspeed model"
weather_features_list=["season","weather","humidity","month","temp","year","atemp"]
# You will change data type of windspeed from data_not_having_windspeed0 into string to use
data_not_having_windspeed0["windspeed"]=data_not_having_windspeed0["windspeed"].astype("str")
# You will use random forest classifier
randomforest_classifier_object_for_predicting_windspeed=RandomForestClassifier()
# You're creating predicting model for windspeed
# And training data for this predicting model is,
# data composed of weather_features_list
# You want to find optimized parameters,
# (letting predicting model for windspeed to learn),
# for this predicting model
# data_not_having_windspeed0[weather_features_list] will be fearues
# data_not_having_windspeed0["windspeed"] will be label
randomforest_classifier_object_for_predicting_windspeed.fit(\
data_not_having_windspeed0[weather_features_list]\
,data_not_having_windspeed0["windspeed"])
# You let predicting model to predict windspeed
prediction_value_for_windspeed=randomforest_classifier_object_for_predicting_windspeed.predict(\
X=data_having_windspeed0[weather_features_list])
prediction_value_for_windspeed0=data_having_windspeed0
prediction_value_for_windspeed_not_0=data_not_having_windspeed0
prediction_value_for_windspeed0["windspeed"]=prediction_value_for_windspeed
merged_date=prediction_value_for_windspeed_not_0.append(prediction_value_for_windspeed0)
# You convert datatype of windspeed into float
merged_date["windspeed"]=merged_date["windspeed"].astype("float")
merged_date.reset_index(inplace=True)
merged_date.drop('index',inplace=True,axis=1)
return merged_date
# You can use predict_windspeed() with putting train data to refine windspeed 0 data
refined_train_dataset_dataframe=predict_windspeed(train_dataset_dataframe)
# test=predict_windspeed(test)
# You can visualize refined data
figure_object,subplot_object1=plt.subplots()
figure_object.set_size_inches(18,6)
plt.sca(subplot_object1)
# data label text on x axis is rotated by 30 degree
plt.xticks(rotation=30,ha='right')
subplot_object1.set(ylabel='Count',title="windspeed of refined train data")
sns.countplot(data=refined_train_dataset_dataframe,x="windspeed",ax=subplot_object1)
# You can confirm windspeed 0 data are eleminated
# img 8b961666-30dc-44e1-b03f-087b7f1d3a84
 # You need to process "feature selection"
# 1. It's required to distinguish between meaningful data and noise data
# 1. It doesn't mean the more feature, the better performance
# 1. It's recommended to add feature one by one,
# with testing performance,
# And you can eliminate feature if it turned out not helpful feature
# continuous feature and categorical feature
# continuous_feature=["temp","humidity","windspeed","atemp"]
# categorical_feature=["season","holiday","workingday","weather","dayofweek","month","year","hour"]
# You will choose following features as categorical feature
categorical_feature_names_list=["season","holiday","workingday","weather","dayofweek","month","year","hour"]
# categorical feature is needed to be categorical data type
for one_category in categorical_feature_names_list:
refined_train_dataset_dataframe[one_category]=refined_train_dataset_dataframe[one_category]\
.astype("category")
test_dataset_dataframe[one_category]=test_dataset_dataframe[one_category].astype("category")
# They show entire features
entire_feature_names_list\
=["season","weather","temp","atemp","humidity","windspeed","year","hour","dayofweek","holiday","workingday"]
# ['season',
# 'weather',
# 'temp',
# 'atemp',
# 'humidity',
# 'windspeed',
# 'year',
# 'hour',
# 'dayofweek',
# 'holiday',
# 'workingday']
# You will create new matrix X_train,
# after preprocessing performed from above
X_traindata_final_dataframe=refined_train_dataset_dataframe[entire_feature_names_list]
X_traindata_final_dataframe.shape
# (10886,11)
X_traindata_final_dataframe.head()
# season weather temp atemp humidity windspeed year hour dayofweek holiday workingday
# 0 1 2 9.84 12.880 75 6.0032 2011 5 5 0 0
# 1 1 1 15.58 19.695 76 16.9979 2011 10 5 0 0
# 2 1 1 14.76 16.665 81 19.0012 2011 11 5 0 0
# 3 1 1 17.22 21.210 77 19.0012 2011 12 5 0 0
# 4 1 2 18.86 22.725 72 19.9995 2011 13 5 0 0
# You create new matrix X_testdata_final_dataframe,
# after preprocessing performed from above
X_testdata_final_dataframe=test_dataset_dataframe[entire_feature_names_list]
# (6493,11)
X_testdata_final_dataframe.head()
# season weather temp atemp humidity windspeed year hour dayofweek holiday workingday
# 0 1 1 10.66 11.365 56 26.0027 2011 0 3 0 1
# 1 1 1 10.66 13.635 56 0.0000 2011 1 3 0 1
# 2 1 1 10.66 13.635 56 0.0000 2011 2 3 0 1
# 3 1 1 10.66 12.880 56 11.0014 2011 3 3 0 1
# 4 1 1 10.66 12.880 56 11.0014 2011 4 3 0 1
# You use "count" feature as y data
label_name_string="count"
y_label_of_traindata=refined_train_dataset_dataframe[label_name_string]
# (10886,)
y_label_of_traindata.head()
# 0 1
# 1 36
# 2 56
# 3 84
# 4 94
# Name: count,dtype: int64
# "bike sharing contest" is evaluated by RMSLE
# You will implement RMSLE algorithm in rmsle()
from sklearn.metrics import make_scorer
def rmsle(predicted_values,actual_values):
# I will use data as numpy array
predicted_values_nparray=np.array(predicted_values)
actual_values_nparray=np.array(actual_values)
# I should implement this formular
# $$$\sqrt{\frac{1}{n} \sum\limits_{i=1}^{n}(\log{(p_{i}+1)}-\log{(a_{i}+1)})^{2}}$$$
log_predict_value=np.log(predicted_values_nparray+1)
log_actual_value=np.log(actual_values_nparray+1)
difference_value=log_predict_value-log_actual_value
# difference=(log_predict_value-log_actual_value)**2
squared_difference_value=np.square(difference)
mean_of_squared_difference_value=squared_difference_value.mean()
rmsle_score_value=np.sqrt(mean_of_squared_difference_value)
return rmsle_score_value
rmsle_scorer=make_scorer(rmsle)
# @
# You will use KFold for cross validation
from sklearn.model_selection import KFold
from sklearn.model_selection import cross_val_score
k_fold_object=KFold(n_splits=10,shuffle=True,random_state=0)
# You will predict by random forest
from sklearn.ensemble import RandomForestRegressor
max_depth_list=[]
# Higher n_estimators makes better precision,
# but consuming more time to predict
randomforest_regressor_object=RandomForestRegressor(n_estimators=100,n_jobs=-1,random_state=0)
RandomForestRegressor(\
bootstrap=True,criterion='mse',max_depth=None,
max_features='auto',max_leaf_nodes=None,
min_impurity_decrease=0.0,min_impurity_split=None,
min_samples_leaf=1,min_samples_split=2,
min_weight_fraction_leaf=0.0,n_estimators=100,n_jobs=-1,
oob_score=False,random_state=0,verbose=0,warm_start=False)
%time score_value_from_cross_val_score=cross_val_score(\
randomforest_regressor_object\
,X_traindata_final_dataframe\
,y_label_of_traindata\
,cv=k_fold_object\
,scoring=rmsle_scorer)
mean_of_score_value_from_cross_val_score=score_value_from_cross_val_score.mean()
# Closer to 0, it's better data
"Score={0:.5f}".format(mean_of_score_value_from_cross_val_score)
# Wall time: 10.5 s
# 'Score= 0.33109'
# You will let model to learn,
# by inputting feature(X_traindata_final_dataframe), label(y_label_of_traindata)
randomforest_regressor_object.fit(X_traindata_final_dataframe,y_label_of_traindata)
# You will let model to predict,
# based on trained model by inputting X_testdata_final_dataframe
predictions_from_test_data=randomforest_regressor_object.predict(X_testdata_final_dataframe)
predictions_from_test_data.shape
# (6493,)
predictions_from_test_data[0:10]
# array([ 12.2 , 4.87, 4.19, 3.47, 3.03, 6.28, 38.1 ,105.49,
# 235.54,136.4 ])
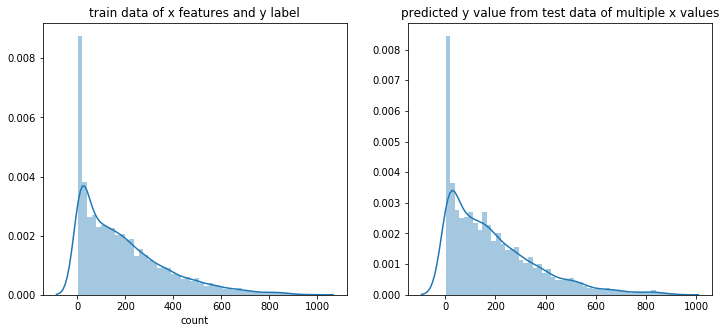
# You will visualize predictions_from_test_data
figure_object,(subplot_object1,subplot_object2)= plt.subplots(ncols=2)
figure_object.set_size_inches(12,5)
sns.distplot(y_label_of_traindata,ax=subplot_object1,bins=50)
subplot_object1.set(title="train data of x features and y label")
sns.distplot(predictions_from_test_data,ax=subplot_object2,bins=50)
subplot_object2.set(title="predicted y value from test data of multiple x values")
# I can see similar distribution of data,
# between "y_label_of_traindata" and "predictions_from_test_data"
# img 87b94e55-5c34-472d-9bd1-ce1ddf1b4bf8
# You need to process "feature selection"
# 1. It's required to distinguish between meaningful data and noise data
# 1. It doesn't mean the more feature, the better performance
# 1. It's recommended to add feature one by one,
# with testing performance,
# And you can eliminate feature if it turned out not helpful feature
# continuous feature and categorical feature
# continuous_feature=["temp","humidity","windspeed","atemp"]
# categorical_feature=["season","holiday","workingday","weather","dayofweek","month","year","hour"]
# You will choose following features as categorical feature
categorical_feature_names_list=["season","holiday","workingday","weather","dayofweek","month","year","hour"]
# categorical feature is needed to be categorical data type
for one_category in categorical_feature_names_list:
refined_train_dataset_dataframe[one_category]=refined_train_dataset_dataframe[one_category]\
.astype("category")
test_dataset_dataframe[one_category]=test_dataset_dataframe[one_category].astype("category")
# They show entire features
entire_feature_names_list\
=["season","weather","temp","atemp","humidity","windspeed","year","hour","dayofweek","holiday","workingday"]
# ['season',
# 'weather',
# 'temp',
# 'atemp',
# 'humidity',
# 'windspeed',
# 'year',
# 'hour',
# 'dayofweek',
# 'holiday',
# 'workingday']
# You will create new matrix X_train,
# after preprocessing performed from above
X_traindata_final_dataframe=refined_train_dataset_dataframe[entire_feature_names_list]
X_traindata_final_dataframe.shape
# (10886,11)
X_traindata_final_dataframe.head()
# season weather temp atemp humidity windspeed year hour dayofweek holiday workingday
# 0 1 2 9.84 12.880 75 6.0032 2011 5 5 0 0
# 1 1 1 15.58 19.695 76 16.9979 2011 10 5 0 0
# 2 1 1 14.76 16.665 81 19.0012 2011 11 5 0 0
# 3 1 1 17.22 21.210 77 19.0012 2011 12 5 0 0
# 4 1 2 18.86 22.725 72 19.9995 2011 13 5 0 0
# You create new matrix X_testdata_final_dataframe,
# after preprocessing performed from above
X_testdata_final_dataframe=test_dataset_dataframe[entire_feature_names_list]
# (6493,11)
X_testdata_final_dataframe.head()
# season weather temp atemp humidity windspeed year hour dayofweek holiday workingday
# 0 1 1 10.66 11.365 56 26.0027 2011 0 3 0 1
# 1 1 1 10.66 13.635 56 0.0000 2011 1 3 0 1
# 2 1 1 10.66 13.635 56 0.0000 2011 2 3 0 1
# 3 1 1 10.66 12.880 56 11.0014 2011 3 3 0 1
# 4 1 1 10.66 12.880 56 11.0014 2011 4 3 0 1
# You use "count" feature as y data
label_name_string="count"
y_label_of_traindata=refined_train_dataset_dataframe[label_name_string]
# (10886,)
y_label_of_traindata.head()
# 0 1
# 1 36
# 2 56
# 3 84
# 4 94
# Name: count,dtype: int64
# "bike sharing contest" is evaluated by RMSLE
# You will implement RMSLE algorithm in rmsle()
from sklearn.metrics import make_scorer
def rmsle(predicted_values,actual_values):
# I will use data as numpy array
predicted_values_nparray=np.array(predicted_values)
actual_values_nparray=np.array(actual_values)
# I should implement this formular
# $$$\sqrt{\frac{1}{n} \sum\limits_{i=1}^{n}(\log{(p_{i}+1)}-\log{(a_{i}+1)})^{2}}$$$
log_predict_value=np.log(predicted_values_nparray+1)
log_actual_value=np.log(actual_values_nparray+1)
difference_value=log_predict_value-log_actual_value
# difference=(log_predict_value-log_actual_value)**2
squared_difference_value=np.square(difference)
mean_of_squared_difference_value=squared_difference_value.mean()
rmsle_score_value=np.sqrt(mean_of_squared_difference_value)
return rmsle_score_value
rmsle_scorer=make_scorer(rmsle)
# @
# You will use KFold for cross validation
from sklearn.model_selection import KFold
from sklearn.model_selection import cross_val_score
k_fold_object=KFold(n_splits=10,shuffle=True,random_state=0)
# You will predict by random forest
from sklearn.ensemble import RandomForestRegressor
max_depth_list=[]
# Higher n_estimators makes better precision,
# but consuming more time to predict
randomforest_regressor_object=RandomForestRegressor(n_estimators=100,n_jobs=-1,random_state=0)
RandomForestRegressor(\
bootstrap=True,criterion='mse',max_depth=None,
max_features='auto',max_leaf_nodes=None,
min_impurity_decrease=0.0,min_impurity_split=None,
min_samples_leaf=1,min_samples_split=2,
min_weight_fraction_leaf=0.0,n_estimators=100,n_jobs=-1,
oob_score=False,random_state=0,verbose=0,warm_start=False)
%time score_value_from_cross_val_score=cross_val_score(\
randomforest_regressor_object\
,X_traindata_final_dataframe\
,y_label_of_traindata\
,cv=k_fold_object\
,scoring=rmsle_scorer)
mean_of_score_value_from_cross_val_score=score_value_from_cross_val_score.mean()
# Closer to 0, it's better data
"Score={0:.5f}".format(mean_of_score_value_from_cross_val_score)
# Wall time: 10.5 s
# 'Score= 0.33109'
# You will let model to learn,
# by inputting feature(X_traindata_final_dataframe), label(y_label_of_traindata)
randomforest_regressor_object.fit(X_traindata_final_dataframe,y_label_of_traindata)
# You will let model to predict,
# based on trained model by inputting X_testdata_final_dataframe
predictions_from_test_data=randomforest_regressor_object.predict(X_testdata_final_dataframe)
predictions_from_test_data.shape
# (6493,)
predictions_from_test_data[0:10]
# array([ 12.2 , 4.87, 4.19, 3.47, 3.03, 6.28, 38.1 ,105.49,
# 235.54,136.4 ])
# You will visualize predictions_from_test_data
figure_object,(subplot_object1,subplot_object2)= plt.subplots(ncols=2)
figure_object.set_size_inches(12,5)
sns.distplot(y_label_of_traindata,ax=subplot_object1,bins=50)
subplot_object1.set(title="train data of x features and y label")
sns.distplot(predictions_from_test_data,ax=subplot_object2,bins=50)
subplot_object2.set(title="predicted y value from test data of multiple x values")
# I can see similar distribution of data,
# between "y_label_of_traindata" and "predictions_from_test_data"
# img 87b94e55-5c34-472d-9bd1-ce1ddf1b4bf8
 # You will submit this code
# For this, you need to input predicted values into sampleSubmission.csv file
# First, you load sampleSubmission.csv file
file_to_be_submitted=pd.read_csv("D://chromedown//kaggle-bike//sampleSubmission.csv")
# I input predictions into submission's count column
file_to_be_submitted["count"]=predictions_from_test_data
file_to_be_submitted.shape
# (6493,2)
print(file_to_be_submitted.head())
# datetime count
# 0 2011-01-20 00:00:00 12.20
# 1 2011-01-20 01:00:00 4.87
# 2 2011-01-20 02:00:00 4.19
# 3 2011-01-20 03:00:00 3.47
# 4 2011-01-20 04:00:00 3.03
# You create file storing scores
file_to_be_submitted.to_csv("D://chromedown//kaggle-bike//Score_{0:.5f}_submission.csv".format(mean_of_score_value_from_cross_val_score),index=False)
# You will submit this code
# For this, you need to input predicted values into sampleSubmission.csv file
# First, you load sampleSubmission.csv file
file_to_be_submitted=pd.read_csv("D://chromedown//kaggle-bike//sampleSubmission.csv")
# I input predictions into submission's count column
file_to_be_submitted["count"]=predictions_from_test_data
file_to_be_submitted.shape
# (6493,2)
print(file_to_be_submitted.head())
# datetime count
# 0 2011-01-20 00:00:00 12.20
# 1 2011-01-20 01:00:00 4.87
# 2 2011-01-20 02:00:00 4.19
# 3 2011-01-20 03:00:00 3.47
# 4 2011-01-20 04:00:00 3.03
# You create file storing scores
file_to_be_submitted.to_csv("D://chromedown//kaggle-bike//Score_{0:.5f}_submission.csv".format(mean_of_score_value_from_cross_val_score),index=False)