This is personal study note
Copyright and original reference:
https://www.youtube.com/watch?v=QcINiIQFN2s&list=PLsri7w6p16vscJ4rkstBZQJqNtZf8Tkxq&index=2&t=0s
================================================================================
Suppose there are 2 variables
Regression inspects "effect of one variable (cause)" to "other variable (result)"
================================================================================
Can you see the causality between advertisement_price and profit
 - By using "correlation analysis", you can see "correlation (like positive or negative correlation)" between 2 variables
- By using "regression analysis", you can predict future data (like profit of 2016) based on past data (like profit of 2001-2015)
- Or, by using "regression analysis", you can explain the relationship between "independent variable" and "dependent variable"
================================================================================
The concept of "dependent variable" and "independent variable"
- By using "correlation analysis", you can see "correlation (like positive or negative correlation)" between 2 variables
- By using "regression analysis", you can predict future data (like profit of 2016) based on past data (like profit of 2001-2015)
- Or, by using "regression analysis", you can explain the relationship between "independent variable" and "dependent variable"
================================================================================
The concept of "dependent variable" and "independent variable"
 - Independent variable
- It occurs by itself
- It independently affects other variables "by itself", so, it's independent
- Dependent variable
- It's affected by independent variables, and then, it's changed
================================================================================
Simple regression analysis
- Independent variable
- It occurs by itself
- It independently affects other variables "by itself", so, it's independent
- Dependent variable
- It's affected by independent variables, and then, it's changed
================================================================================
Simple regression analysis
 Simple regression analysis
- Analysis method which analyzes "effect of independent variable X" to "dependent variable Y"
- by using regression equation
- Note that the number of "independent variable" is only 1
- For example, X: advertisement_price, Y: profit
- If the number of "independent variable" is greater than 2, it's multiple regression analysis
- For example, X1: advertisement_price, X2: the size of company, X3: the location of company, Y: profit
================================================================================
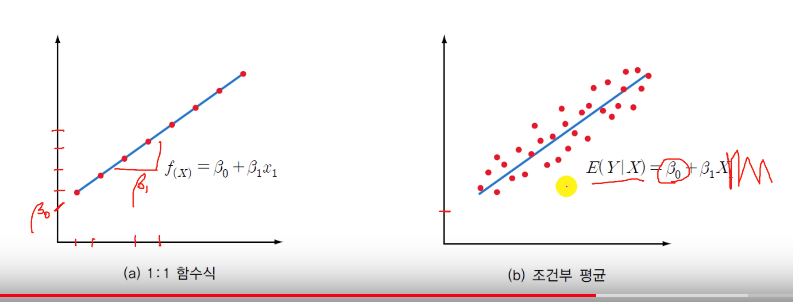
Different regression equation graph pattern in natural science/engineering and social science
Simple regression analysis
- Analysis method which analyzes "effect of independent variable X" to "dependent variable Y"
- by using regression equation
- Note that the number of "independent variable" is only 1
- For example, X: advertisement_price, Y: profit
- If the number of "independent variable" is greater than 2, it's multiple regression analysis
- For example, X1: advertisement_price, X2: the size of company, X3: the location of company, Y: profit
================================================================================
Different regression equation graph pattern in natural science/engineering and social science
 ================================================================================
How to calculate the slope $$$\beta_1 = \dfrac{\delta Y} {\delta X}$$$
================================================================================
How to calculate the slope $$$\beta_1 = \dfrac{\delta Y} {\delta X}$$$
 ================================================================================
Residual $$$\epsilon$$$
================================================================================
Residual $$$\epsilon$$$
 $$$Y=\beta_0 + \beta_1 X_1$$$ can't fully explain the pattern of data
So, you need to add residual term $$$\epsilon$$$ into regression equation
$$$Y=\beta_0 + \beta_1 X_1 + \epsilon$$$
Residual $$$\epsilon$$$ tries to minimize the error between "predicted line" and "pattern of real data"
Residual $$$\epsilon$$$ occurs randomly in its value
$$$Y=\beta_0 + \beta_1 X_1$$$ can't fully explain the pattern of data
So, you need to add residual term $$$\epsilon$$$ into regression equation
$$$Y=\beta_0 + \beta_1 X_1 + \epsilon$$$
Residual $$$\epsilon$$$ tries to minimize the error between "predicted line" and "pattern of real data"
Residual $$$\epsilon$$$ occurs randomly in its value